Engineering and Applied Science Letter
ISSN: 2617-9709 (Online) 2617-9695 (Print)
DOI: 10.30538/psrp-easl2019.0014
Box-Behnken design of quadratic model for Gas Metal Arc Welding (GMAW) and optimization analysis on desirability function
Department of Mechanical Engineering, King Fahd University of Petroleum and Minerals (KFUPM), Dhahran, Kingdom of Saudi Arabia. (K. N & A. K & M. A)
Abstract
Keywords:
1. Introduction
In Gas Metal Arc Welding (GMAW), materials are melted and joined by heating them by an arc which is produced between filler wire which is continuously fed the metals. Arc is protected and shielded by using inert gases like Helium and Argon and because of this GMAW is also called Metal Inert Gas (MIG) process. Other than inert gases some active gases i.e. \(CO_{2}\) are used so GMAW is now the widely used name for this process. This is constant voltage process and Direct Current Electrode Positive (DCEN) is used in GMAW. Either Direct Current Electrode Positive (DCEN) or Alternating Current (AC) transfer of metal is unreliable. But here arc is a stable transfer of metal smoothly, low chances of spatters, and high penetration is worthy characteristics of this process [1, 2].
M. Azadi [3] studied the optimization of GMAW over API-X42 material through L36 Taguchi matrix and proposed back propagation neural network (BPNN). Omer Bataineh [4] studied the GMAW process to find the effects of welding factors over welding strength; the optimization was done through factorial design methodology and ANOVA. Izzatul [5] optimized the welding responses such as penetration, microstructural and hardness by utilizing robotic GMAW process. Pawan Kumar [6] studied the dissimilar welding joints welded by GMAW and optimized the result by Taguchi orthogonal L9 array and analysis was concluded based on the signal to noise ratios. Chandresh [7] worked with full factorial design experiment to optimize the GMAW responses on AISI 1020 material.
All above investigation and experimental study were conducted on GMAW process under a controlled environment such as well-established and equipped closed welding workshop whereas we have studied the semi-automatic GMAW performed under tough environmental conditions such as windy and dusty in the mobile or outdoor welding shop. Through data mining of field engineering on nominal identical data on which we have done field study and relevant data points are chosen. The portable welding shop is the shop which moves the location to location base on projects scope such as for cross-country pipeline.
2. Process Features and Parameters [1]
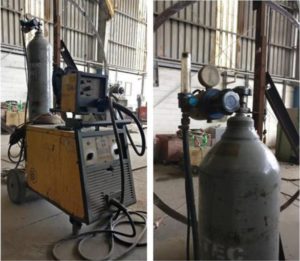
In the gas metal welding, arc regulation is auto-adjusted by any of two ways. The most known technique is to employ a constant-speed electrode feed unit with a variable current and constant voltage source. With the variation of gap between gun and work piece, the variation in arc length is also noted, where if arc length decrease power source gives more current and if arc length increases then of course less current. So there will be relevant changes in meting rate due to such changes in current which in turn require maintaining arc length. Other technique of arc regulation is to employ a constant-current source along with adjustable-speed, voltage-sensing electrode feeder. Here any change in arc length originates a relevant variation in the AC voltage. Based on the electrode feed unit changes the speed of filler metal wire depending upon higher/lower speed. This is more useful for larger electrodes when lower feed speed of filler metal wire is required. The GMAW setup used for the research work is depicted in Figure 1.
Figure 1. Gas metal arc welding (GMAW) process setup used for welding data collection.
3. Design of Experiment Methodology [8, 9]
The factors can be classified as either continuous with low and high value or categorical with different level. We have selected continuous type of factors instead of the categorical type with minimum and maximum value because GMAW factor's values fluctuate frequently due to welding in the temporary welding shop. Design of experiment is done by selecting voltage (V), welding consumable feed speed (mm), and travel speed (cm/mm) as continuously controllable factors with low and high values as defined in Table 2. These controllable factor's effects are studied on four responses such as weld bead (mm), bead reinforcement height (mm), penetration depth (mm) and deposition efficiency(%). Each response is assigned with minimum and maximum values which are obtained from design condition for ASME B31.3 process piping for non-sour and non-lethal service and are mentioned in Table 1. The response's results are studied and analyzed on mean values basis and target to maximize the mean of the depth of penetration, deposition efficiency. The quantitative relation between responses and factors in term of Response Surface Methodology (RSM) can be expressed as below: \begin{equation*} Y = f( \text{Voltage, wire feed , travel speed}) \end{equation*} whereas \(Y\) is the responses which are to be optimized and \(V, F\) \& \(S\) are the controllable factors. The system behavior will be obtained through quadric model or by higher order polynomial model which is developed by the least square method by considering the interaction of factors to maximize or minimize the response variables, below is the quadratic model for author case:Table 1. Defining of controllable factors to be measured.
| Name | Units | Type | Role | Low | High |
|---|---|---|---|---|---|
| A:Welding Voltage | V | Continuous | Controllable | 29.0 | 34.2 |
| B: Wire Feed Speed | mm | Continuous | Controllable | 3.9 | 9.7 |
| C:Welding Speed | mm/min | Continuous | Controllable | 50.0 | 70.0 |
Table 2. Defining of responses to be varied.
| Name | Units | Analyze | Goal | Impact | Sensitivity | Low | High |
|---|---|---|---|---|---|---|---|
| Depth of Penetration | mm | Mean | Maximize | 3.0 | Medium | 4.5 | 6.0 |
| Deposition Efficiency | % | Mean | Maximize | 3.0 | Medium | 55.6 | 93.4 |
| Bead Width | mm | Mean | Maximize | 3.0 | Medium | 6.5 | 8.0 |
| Bead Reinforcement | mm | Mean | Maximize | 3.0 | Medium | 0.7 | 3.0 |
Table 3. Design of experiments for a gas metal arc welding process.
| Type of Factors | Design Type | Center points Per Block | CenterPoint Placement | Design is Randomized | Number of Replicates | Total Runs | Total Blocks |
|---|---|---|---|---|---|---|---|
| Process | Box-Behnken design | 3 | Last | Yes | 1 | 30 | 2 |
Figure 2. Joint Design Detail used for GMAW Welding.
Table 4. GMAW data for optimization process.
| Sr. No. | Factors | Responses | |||||
|---|---|---|---|---|---|---|---|
| F1 | F2 | F3 | R1 | R2 | R3 | R4 | |
| Voltage | Wire Feed | Travel Speed | Depth of Penetration (mm) | Deposition Efficiency (%) | Bead Width (mm) | Weld Reinforcement (mm) | |
| 1 | 29 | 6.8 | 50.0 | 5 | 55.6 | 6.50 | 0.7 |
| 2 | 34.2 | 6.8 | 70.0 | 6 | 91.6 | 6.50 | 2.0 |
| 3 | 29 | 9.7 | 60.0 | 5 | 90 | 6.00 | 2.0 |
| 4 | 31.6 | 3.9 | 50.0 | 5.5 | 77 | 8.50 | 3.0 |
| 5 | 29 | 3.9 | 70.0 | 5 | 77 | 8.00 | 2.5 |
| 6 | 31.6 | 3.9 | 50.0 | 4.5 | 56 | 6.50 | 0.8 |
| 7 | 34.2 | 6.8 | 70.0 | 5.5 | 92.5 | 6.50 | 2.2 |
| 8 | 34.2 | 9.7 | 60.0 | 6 | 92 | 6.00 | 2.2 |
| 9 | 31.6 | 9.7 | 50.0 | 6.5 | 80 | 8.00 | 3.0 |
| 10 | 31.6 | 9.7 | 60.0 | 5.3 | 92.3 | 6.50 | 2.0 |
| 11 | 34.2 | 3.9 | 70.0 | 5.2 | 92.1 | 6.40 | 2.0 |
| 12 | 29 | 6.8 | 50.0 | 5.3 | 92.3 | 6.50 | 2.0 |
| 13 | 31.6 | 6.8 | 60.0 | 5 | 92.2 | 6.50 | 2.0 |
| 14 | 34.2 | 9.7 | 70.0 | 5.3 | 88.7 | 7.0 | 3.0 |
| 15 | 31.6 | 3.9 | 50.0 | 5.6 | 90.2 | 7.7 | 2.9 |
| 16 | 31.6 | 6.8 | 60.0 | 5.3 | 90.7 | 6.3 | 2.5 |
| 17 | 34.2 | 3.9 | 70.0 | 5.3 | 88.6 | 7.8 | 3.1 |
| 18 | 29 | 6.8 | 50.0 | 6.0 | 94.7 | 7.3 | 2.7 |
| 19 | 31.6 | 9.7 | 60.0 | 6.1 | 94.0 | 9.4 | 2.9 |
| 20 | 34.2 | 9.7 | 70.0 | 6.1 | 94.6 | 6.1 | 2.5 |
| 21 | 31.6 | 3.9 | 50.0 | 5.7 | 93.0 | 8.5 | 2.9 |
| 22 | 31.6 | 6.8 | 60.0 | 5.2 | 88.3 | 6.3 | 2.9 |
| 23 | 34.2 | 6.8 | 70.0 | 5.2 | 87.7 | 7.0 | 3.0 |
| 24 | 29 | 9.7 | 50.0 | 5.2 | 89.1 | 6.3 | 2.5 |
| 25 | 31.6 | 3.9 | 60.0 | 5.4 | 89.4 | 7.7 | 2.9 |
| 26 | 34.2 | 6.8 | 70.0 | 5.8 | 93.3 | 7.3 | 2.7 |
| 27 | 29 | 3.9 | 50.0 | 6.3 | 96.5 | 9.6 | 3.4 |
| 28 | 31.6 | 6.8 | 60.0 | 5.9 | 95.2 | 6.6 | 2.6 |
| 29 | 34.2 | 9.7 | 70.0 | 6.3 | 98.9 | 10.5 | 2.6 |
| 30 | 31.6 | 3.9 | 50.0 | 5.6 | 91.7 | 6.6 | 2.8 |
4. Analyze the Experiments Results [8]
The variance's analysis is performed by Analysis of variance (ANOVA) was conducted to investigate the controllable factor's influences on measured responses then the standardized Pareto chart is drawn for each response with respect to significant factors. The analysis of variance is calculated for each of response and is explained in detail, refer below to Table 5 for depth of penetration, Table 6 for deposition efficiency, Table 7 for bead width and Table 8 for weld reinforcement height:Table 5. Variance's analysis for SQRT of Depth of Penetratione.
| Source | Sum of Squares | Dof | Mean Square | F-Ratio | P-Value |
|---|---|---|---|---|---|
| A:Welding Voltage | 0.0330452 | 1 | 0.0330452 | 1.73 | 0.2799 |
| B:Wire Feed Speed | 0.0384051 | 1 | 0.0384051 | 2.01 | 0.2512 |
| C:Welding Speed | 0.0113129 | 1 | 0.0113129 | 0.59 | 0.4975 |
| AA | 0.00000229293 | 1 | 0.00000229293 | 0.00 | 0.9919 |
| AB | 0.00715199 | 1 | 0.00715199 | 0.37 | 0.5838 |
| AC | 0.00036437 | 1 | 0.00036437 | 0.02 | 0.8989 |
| BB | 0.0000164209 | 1 | 0.0000164209 | 0.00 | 0.9784 |
| BC | 0.000137468 | 1 | 0.000137468 | 0.01 | 0.9377 |
| CC | 0.0020654 | 1 | 0.0020654 | 0.11 | 0.7639 |
| Total error | 0.0572911 | 3 | 0.019097 | ||
| Total (corr.) | 0.150612 | 12 |
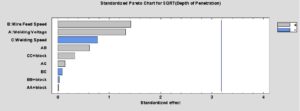
Table 5 is the variance analysis known as ANOVA where statistical significance is calculated by associating the experimental error with a mean square. The mean square value was obtained by computing the variability in Sq-Root (DOP) into a distinct run for each of the effects. In author occasion, no interactions of factors have P-values less than 0.05 which confirmed that all interactions are meaningfully diverse from "0" at the 95.0% confidence level.
The R-Squared calculation shows that the model as fitted illuminates 59.7% of the variability in Sq-Root (Depth of Penetration). The adjusted R-squared calculation is 39.55%, The standard error of the calculation indicates as 0.0871038.
The mean absolute error of 0.0590065 is the average value of the residuals.
Figure 3. Pareto Chart for SQRT of the depth of penetration.
Table 6. Variance's analysis for SQRT of Deposition Efficiency.
| Source | Sum of Squares | Dof | Mean Square | F-Ratio | P-Value |
|---|---|---|---|---|---|
| A:Welding Voltage | 1.16387 | 1 | 1.16387 | 2.45 | 0.2158 |
| B:Wire Feed Speed | 1.12495 | 1 | 1.12495 | 2.36 | 0.2217 |
| C:Welding Speed | 0.272031 | 1 | 0.272031 | 0.57 | 0.5045 |
| AA | 0.00838265 | 1 | 0.00838265 | 0.02 | 0.9028 |
| AB | 0.128551 | 1 | 0.128551 | 0.27 | 0.6391 |
| AC | 1.20742 | 1 | 1.20742 | 2.54 | 0.2094 |
| BB | 0.205795 | 1 | 0.205795 | 0.43 | 0.5577 |
| BC | 0.95518 | 1 | 0.95518 | 2.01 | 0.2515 |
| CC | 0.821663 | 1 | 0.821663 | 1.73 | 0.2802 |
| Total error | 1.42735 | 3 | 0.475783 | ||
| Total (corr.) | 7.44221 | 12 |
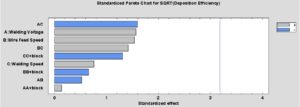
Figure 4. Pareto Chart for SQRT (Deposition Efficiency).
Table 7. Variance's analysis for SQRT of Bead Width.
| Source | Sum of Squares | DOF | Mean Square | F-Ratio | P-Value |
|---|---|---|---|---|---|
| A:Welding Voltage | 0.0111456 | 1 | 0.0111456 | 0.42 | 0.5650 |
| B:Wire Feed Speed | 0.037308 | 1 | 0.037308 | 1.39 | 0.3232 |
| C:Welding Speed | 0.0519844 | 1 | 0.0519844 | 1.94 | 0.2581 |
| AA | 0.0122513 | 1 | 0.0122513 | 0.46 | 0.5475 |
| AB | 0.0222912 | 1 | 0.0222912 | 0.83 | 0.4291 |
| AC | 0.0 | 1 | 0.0 | 0.00 | 1.0000 |
| BB | 0.0177043 | 1 | 0.0177043 | 0.66 | 0.4760 |
| BC | 0.00189437 | 1 | 0.00189437 | 0.07 | 0.8076 |
| CC | 0.0122513 | 1 | 0.0122513 | 0.46 | 0.5475 |
| Total error | 0.0804485 | 3 | 0.0268162 | ||
| Total (corr.) | 0.271784 | 12 |
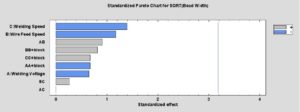
Figure 5. Pareto Chart for SQRT of Bead width.
Table 8. Variance's analysis for SQRT of Weld Reinforcement.
| Source | Sum of Squares | DOF | Mean Square | F-Ratio | P-Value |
|---|---|---|---|---|---|
| A:Welding Voltage | 0.0376313 | 1 | 0.0376313 | 0.24 | 0.6554 |
| B:Wire Feed Speed | 0.0222486 | 1 | 0.0222486 | 0.14 | 0.7295 |
| C:Welding Speed | 0.0523154 | 1 | 0.0523154 | 0.34 | 0.6013 |
| AA | 0.00538944 | 1 | 0.00538944 | 0.03 | 0.8637 |
| AB | 0.0139183 | 1 | 0.0139183 | 0.09 | 0.7836 |
| AC | 0.104516 | 1 | 0.104516 | 0.68 | 0.4709 |
| BB | 0.0264368 | 1 | 0.0264368 | 0.17 | 0.7068 |
| BC | 0.0675445 | 1 | 0.0675445 | 0.44 | 0.5556 |
| CC | 0.0141117 | 1 | 0.0141117 | 0.09 | 0.7821 |
| Total error | 0.46308 | 3 | 0.15436 | ||
| Total (corr.) | 0.841292 | 12 |
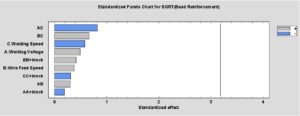
Figure 6. Pareto Chart for SQRT of Reinforcement height.
5. Optimization through Desirability-Function [8]
Optimum factors setting values are obtained through the value of optimized desirability which is obtained by considering the combined results of all five responses for specific predicted values. For optimization of response values, we have selected confident level of 95%. Whereas predicted values of each response is a mean value of upper 95% and lower 95% limit. Observed desirability is calculated from observed values of all response's values for each run of an experiment by using Derringer's model. Whereas predicted desirability is obtained from predicted values of all response base on lower and upper 95% limits of the confidence level.6. Desirability Function [9, 10, 11 ]
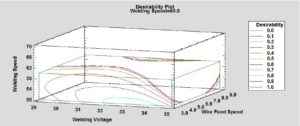
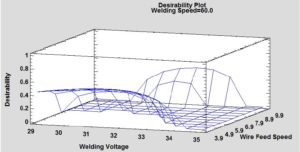
The desirability function and loss function are used optimized approaches and we have used desirability function methodology because it is more applicability and flexibility as compared to loss function moreover it is a most suitable function to solve multi-objective optimization problems. As per definition is given by Harrington [9], "converts every response's value into scale-free value is known as desirability". The desirability function was also studied and shared by Derringer and Suich's [10] which is used for nominal-the best (NTB), larger-the-best (LTB), smaller-the-best (STB) type of measurable responses. In our DOE, we have selected the larger the best which is defined as: \[ d(i)= \begin{cases} 0, & yl \leq LSL_{i} \\ \frac{\hat{y}-USL_{i}}{LSL_{i}-USL_{i}}, & LSL \le \hat{y} \le USLi{i}\\ 1, & yl = USL_{i} \end{cases} \] Where \(d(i)\) is the desirability function, yet is the response, \(USL_{i}\) is the upper 95% limit and \(LSL_{i}\) is the lower 95% limits. Table 9 shows all calculation where responses are optimized by getting their prediction by taking the mean of lower 95.0% limits and upper 95.0% limit. Base on Derringer and Suich's desirability function as defined above, the desirability is calculated for depth of penetration, deposition efficiency, bead width, and bead reinforcement are 52.8%, 85.3%, 81.3% and 93.9% respectively [8]. The overall desirability or optimized desirability is equaled 77%, which is obtained by considering the desirability of all responses then taking each value to the power equal to its impact, taking the product of both results, and the resultant product raises to a power equal to 1 divided by impact summation.Table 9. Optimum Response Values.
| Response | Optimized | Prediction | Lower 95.0% Limit | Upper 95.0% Limit | Desirability |
|---|---|---|---|---|---|
| Depth of Penetration | yes | 5.2921 | 3.47671 | 7.48744 | 0.528068 |
| Deposition Efficiency | yes | 87.8636 | 51.8112 | 133.382 | 0.853534 |
| Bead Width | yes | 7.72064 | 5.11714 | 10.8577 | 0.813758 |
| Bead Reinforcement | yes | 2.8614 | 0.204658 | 8.58927 | 0.939741 |
Table 10. Factor settings at optimum.
| Factor | Setting |
|---|---|
| Welding Voltage | 33.2783 |
| Wire Feed Speed | 3.9 |
| Welding Speed | 60.0 |
Figure 7. Optimum factors setting at the optimum desirability.
Figure 8. Optimum factors setting at the optimum desirability.
7. Validation, Discussion, and Conclusion
After getting the optimal values for factors next stage was to validate these values. In order to do this final weld, the run was conducted by using these optimal values obtained during these analyses. Welding was performed under same circumstances using the same material. Final results were obtained and found very close to the optimal responses as mentioned in Table 11.Table 11. Comparison between optimized and actual results.
| Optimized Factors | Optimized Responses | Actual Results (Responses) |
|---|---|---|
| Welding Voltage = 33.2 V | Depth of Penetration = 5.2921 mm | Depth of Penetration = 5.3 mm |
| Wire Feed Speed = 3. mm | Deposition Efficiency =87.8 % | Deposition Efficiency = 90 % |
| Welding Speed = 60 cm/ mm | Bead Width = 7.72 mm | Bead Width = 6.52 mm |
| Reinforcement = 2.86 mm | Reinforcement = 2.2 mm |
Acknowledgements
The completion of this research work could not be possible without support and assistance of so many people whose names may not all be enumerated, however, we would like to express our thanks to particular Mr. Ali Raza lone - QC manager of Saudi Arkad, Mr. Azhar - Ph.D. student of King Fahd University of Petroleum and Minerals (KFUPM), Mr. Saravanan - JGC Department Manager of Construction and the most Mr. ITO Kenji - Senior Manager JGC for their endless support during my research work. The research work's Abstract of same methodology on Flux-cored arc welding (FCAW) was also presented in 15th Annual Congress on Materials Research & Technology [13].Competing Interests
The authors declare no competing interest.References
- ASMIH Committee. (1993). ASM Handbook, Volume 06-Welding, Brazing, and Soldering. ASM International, 160-164. [Google Scholor]
- Kou, S. (2003). Welding metallurgy. Hoboken, New Jersey: John Wiley & Sons [Google Scholor]
- Moghaddam, M. A., Golmezergi, R., & Kolahan, F. (2016). Multi-variable measurements and optimization of GMAW parameters for API-X42 steel alloy using a hybrid BPNN-PSO approach. Measurement, 92, 279-287. [Google Scholor]
- Bataineh, O., Al-Shoubaki, A., & Barqawi, O. (2012). Optimising Process Conditions in MIG Welding of Aluminum Alloys Through Factorial Design Experiments. Latest Trends in Environmental and Manufacturing Engineering, 21-26. [Google Scholor]
- Ibrahim, I. A., Mohamat, S. A., Amir, A., & Ghalib, A. (2012). The Effect of Gas Metal Arc Welding (GMAW) processes on different welding parameters. Procedia Engineering, 41, 1502-1506. [Google Scholor]
- Kumar, P., & Roy, B. K. (2013). Parameters Optimization for Gas Metal Arc Welding of Austenitic Stainless Steel (AISI 304) & Low Carbon Steel using Taguchi's Technique. International Journal of Engineering and Management Research (IJEMR), 3(4), 18-22.[Google Scholor]
- Patel, C. N., & Chaudhary, S. A. N. D. I. P. (2013). Parametric optimization of weld strength of metal inert gas welding and tungsten inert gas welding by using analysis of variance and grey relational analysis. International Journal of Research in Modern Engineering & Emerging Technology, 1(3), 48-56. [Google Scholor]
- Statgraphics Centurion XVII - http://www.statgraphics.com/centurion-xvii. [Google Scholor]
- Nazir, K. (2018). Field Data for GMAW Welding variables and responses for process optimization Studies. Research gate,
- Harrington, E. C. (1965). The desirability function. Industrial quality control, 21(10), 494-498.
- Derringer, G., & Suich, R. (1980). Simultaneous optimization of several response variables. Journal of quality technology, 12(4), 214-219.[Google Scholor]
- Bashiri, M., Shiri, M., & Bakhtiarifar, M. H. (2015). A robust desirability-based approach to optimizing multiple correlated responses. International Journal of Industrial Engineering & Production Research, 26(2), 119-128.[Google Scholor]
- Nazir, K., Sheikh, A. k., & Ahmad, M. A. (2018). Optimization Of flux cored arc welding (fcaw) by cube composite design and desirability function. Journal of Material Sciences & Engineering, 7(2018).

