Open Journal of Chemistry
ISSN: 2618-0758 (Online) 2618-074X (Print)
DOI: 10.30538/psrp-ojc2019.0013
Investigation of nanostructured iron oxides as anodic material for water splitting
Masood Rauf Khan\(^1\), Zahid Sarfraz, Hafiz Sami ur Rehman
Department of Physics, University of Trento, Trento, Italy.; (M.R K & Z.S)
Department of Materials and Production Engineering, University of Trento, Trento, Italy.; (H.S.R)
\(^{1}\)Corresponding Author; masoodrauf.khan@alumni.unitn.it
Abstract
Keywords:
1. Introduction
To reduce our dependence on fossil fuels and reduce the emission of carbon dioxide, a large scale transition toward sustainable energy sources is necessary [1]. In this regards Hydrogen could play an important role in our modern life. It is a promising energy carrier, which could have a low impact on the environment and its energy content is 10 times greater than fossil fuels. Hydrogen production through the water splitting is a cheapest and clean source of energy [2]. On large scale production of hydrogen from the water splitting, largely depend upon the catalysts that are require to overcome the challenging requirement thermodynamically and kinetics of this half reaction [3, 4]. From an electrochemical point of view, it can be split into the two half reactions:
\ (OER) \end{equation}
\ (HER) \end{equation}
The oxygen evolution reaction (OER) is a key reaction and often the rate-determining step in electrochemical and Photoelectrochemical water splitting, which is a promising route to carbon-free hydrogen production. For this process we require the OER catalysts which are close to the state- of art catalysts. Iron oxide (\(\alpha\)-hematite) because it has been identified as a suitable water oxidation catalyst [5, 6, 7, 8, 9, 10], conjugating an overall good performance in both electrolysis and solar water splitting schemes with the advantage of being earth-abundant, non-toxic and environmentally safe.
Pulsed-laser deposition (PLD) of thin films is a technique that employs high-energy-density laser pulses to generate, in the regime of phase explosion, ablated material from a solid target, consisting of a mixture of vapor/liquid nanodroplets. PLD could present some significant advantages over the methods listed above: precise control of the quantity of the deposited material, enhanced adhesion due to the energetic nature of the process, and, most importantly, the possibility of nanostructuring the surface by the deposition of nanoparticles (NPs) [11, 12]. Additionally, being essentially a physical deposition method, it is suitable to all kind of substrates. The main drawback of the PLD technique is the need of specialized equipment, although this is already employed in industrial applications.
2. Materials and Methods
The target for the Pulse laser deposition consisted of the cold pressed with a pressure of about \(450-500Kg/cm^2\) for two times consecutively powders of Fe and Boric acid. Two sets of electrodes, fabricated on the FTO substrates with different thickness by changing the number of pulses: 5000 pluses for the thinner samples and \(10000\) pulses for the thicker samples. The fluency of the laser was fixed at 3\(J/cm^2\) and the deposition was carried out in a reactive oxygen atmosphere, at a pressure of \(1.5\times10^{-2}\) mbar. The number of pulses set at \(5000\) and the repetition rate at \(20Hz\). The coatings were deposited on FTO substrates, with a target - substrate distance of \(4.5 cm\). All the sample were subjected to a post-deposition annealing treatment, carried out at different Temperature i.e. \(500^oC, 600^oC\) and \(700^oC\) for 4 hours with heating rate of \(5^oC/min\) and one sample subjected at \(600^oC\) for 4 hours and again at \(800^oC\) for 1hours with heating rate of \(5^oC/min\). We represent the differently annealed sample with the following symbols:
| Sample | Temperature |
|---|---|
| Thin sample annealed at \(500^oC\) for 4 hours | ANN\(@500^oC\) |
| Thin sample annealed at \(600^oC\) for 4 hours | ANN\(@600^oC\) |
| Thin sample annealed at \(700^oC\) for 4 hours | ANN\(@700^oC\) |
| Thin sample annealed at \(600^oC\) and \(800^oC\) for 4 hours | ANN\(@600^oC+800^oC\) |
| Thin sample annealed at \(500^oC\) for 4 hours | ANN\(@500^oC\) thick |
| Thin sample annealed at \(600^oC\) for 4 hours | ANN\(@600^oC\) thick |
| Thin sample annealed at \(700^oC\) for 4 hours | ANN\(@700^oC\) thick |
| Thin sample annealed at \(600^oC\) and \(800^oC\) for 4 hours | ANN\(@600^oC+800^oC\) thick |
The following SEM images show the morphology of the thin films. Samples ANN\(@500^oC\) Figure 1 and ANN\(@600^oC\) Figure 2 show the presence of urchin-like structures, increasing the surface of the catalyst and thus the amount of active sites for the water oxidation.
Figure 1. SEM Images Annealing at \(500^o\)C for 4 hours with heating rate \(5^oC\)/min
The lengths of needles are not homogeneous, dense and aggregated nanoparticles are found at \(600^oC\) annealing temperature. Furthermore, SEM images show the nano needle with a non-uniform morphology. Samples show spherical nanoparticles covered with sparse nano flowers. The flower consists of needles petals grown radially from the surface. Probably the roughness present on the core surface is the starting point for the formation of these features. Overall SEM images confirm the urchin like structure on samples ANN\(@500^oC\) and ANN\(@600^oC\).
Figure 2. SEM Images Annealing at \(600^oC\) for 4 hours with heating rate \(5^oC\)/min
Sample ANN\(@600^oC + 800^oC\) Figure 3, show that there is no developed urchin like structures. At \(700^oC\) Figure 4 samples show spherical nanoparticles covered with sparse nano flowers. The flower consists of needles petals grown radially from the surface. Probably the roughness present on the core surface is the starting point for the formation of these features. As will be shown in the following sections, the electrochemical performance of these samples is not good. Here I discuss the thin sample SEM images because these are similar to the thick sample.
Figure 3. SEM Images Annealing at \(600^oC\) for 4 hours and at \(800^oC\) for 1 hour with heating rate \(5^oC\)/min
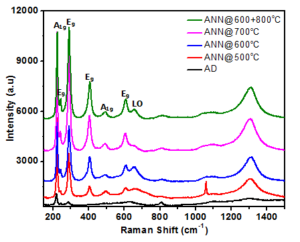
Figure 4. Raman spectra of the sample
2.1. Result and Discussion
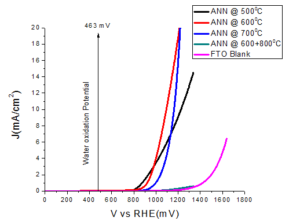
Electrochemical water oxidation experiments were performed in a three electrode configuration with a working electrode (Iron oxide thin film on FTO), a platinum mesh as counter electrode and saturated calomel electrode (SCE) as a reference electrode, with Gamry Interface 1000 potentiostate. All the electrodes are immersed in a KOH electrolyte solution with pH=13. At this pH, oxygen evolution is expected at potential EO2/H2O = 1.23 - (0.059pH) = 0.463 V (463mV) versus reversible hydrogen electrode (RHE). The Figure 5 compares the anodic response of various thin electrodes annealed at various temperatures.Figure 5. Plots of the current density with respect to the applied potential on the thin electrode.
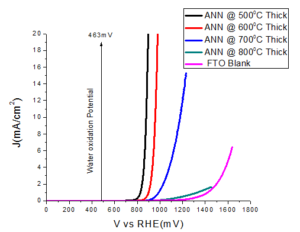
Figure 6. Plots of the current density with respect to the applied potential on the thick electrode
The samples ANN\(@500^{o}C\) and ANN\(@600^{o}C\) show good catalytic performance, in term of overpotential. Large overpotential is associated with slower kinetics for the OER on hematite and with the electronic and structural characteristic of the hematite/electrolyte and hematite/substrate interfaces. After increasing the thickness of the film, then again film ANN\(@500^oC\) thick and ANN\(@600^oC\) thick showed good catalytic performance, both in term of overpotential and tafel slope as compared to the thin films (Table 1). Other samples ANN\(@700^oC\) and ANN\(@600^oC\)+\(800^oC\) display the bad catalytic enactment. The detrimental in water oxidation activity for the samples annealed more than \(600^oC\) could be due to the losing of the conducting properties of FTO. Since, it is clear known that FTO losses its conductivity above \(550^oC\). Thereby, it is clear that the decreased activity is mainly due to the losing FTO conductivity at high temperature annealing.
The overpotential is calculated as
$$Overpotential=V_{Applied}+0.241-E^oO_2/H_2O$$
Where \(E^oO_2/H_2O = 463\) mV at pH = 13 and the 240 mV term is required to convert the applied potential Vapplied from SCE to RHE (Reversible Hydrogen Electrode). Samples overpotential and Table slopes are shown in Table 1.
Table 1. Overpotentials at various current densities and Table slopes of the thin and thick films annealed at various temperatures.
| Sample | Overpotenital | Overpotenital | Overpotenital | Tafel slope |
|---|---|---|---|---|
| at 0.2(mA) | at 1(mA) | at 10(mA) | mV/dec\(^{-1}\) | |
| Ann\(@500^o C\) thin | 343.9 | 412.4 | 769.8 | 81.6+0.6 |
| Ann\(@600^o C\) thin | 370.0 | 457.0 | 631.1 | 109.8+0.2 |
| Ann\(@700^o C\) thin | 455.6 | 534.5 | 699.9 | 135.8+0.5 |
| Ann\(@600^o C+800^o C\) thin | 708.9 | 103.9 | --- | 373.7+2.9 |
| Ann\(@500^o C\) thin | 329.1 | 364.5 | 416.5 | 50.2+0.09 |
| Ann\(@600^o C\) thin | 398.8 | 436.6 | 495.6 | 56.0+0.1 |
| Ann\(@700^o C\) thin | 463.5 | 526.4 | 414.4 | 83.2+0.7 |
| Ann\(@600^o C+800^o C\) thin | 615.2 | 865.0 | --- | 258.8+2.8 |
3. Tafel analysis
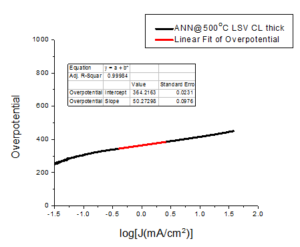
The Tafel slope is also an important measure of electrode performance, because it accounts for changes in mechanism at different overpotential.Figure 7. Tafel slope of sample ANN\(@500^oC\) thick
4. Chronoamperometries
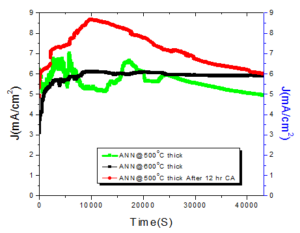
A good OER catalyst that use in the water splitting device must satisfy the two basic requirement. First it must be highly active towards its respective reaction. Secondly it must be stable in the oxidation condition and maintain the efficiency over the time scale for commercial use.Figure 8. 12 h Chronoamperometries of thick sample ANN\(@500^oC\), ANN\(@600^oC\) and again 12 h ANN\(@500^oC\)
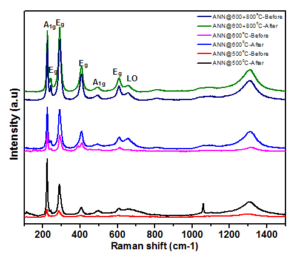
Figure 9. Raman spectra of the sample before and after water oxidation.
I am raw html block.
Click edit bBefore and after water oxidation the miro-Raman spectra for all the samples are represented in the Figure 9. It is indicating that after water oxidation the peak intensities were reduced, the probable reason could be due to the surface coverge of the electrolyte. However, the phase and crystallinity of the all the samples were well preserved ever after water oxidation, showing that the prepared thin film samples are highly stable to the water oxidation experiments.
5. Conclusion
We investigated that the Iron oxide (\(\alpha\)-hematite) was showing promising catalytic activity towards the oxygen evolution reaction and can be employed as anode in electrocatalytic water splitting techniques for hydrogen production. The best performing electrodes showed an overpotential@0.2 mA/cm2 of about 330 mV and a Tafel slope of 50mV/dec. These electrode metrics are in line with those of current state-of-the-art materials like IrO\(_2\) or CoPi. We observe that the deposition of more material, e.g 10000 instead of 5000 pulses, leads to better overpotentials and Tafel slopes, indicating that the performance can be enhanced simply by increasing the catalyst loading. That is normally not possible for bulk-like thick films or even thin-films where the surface coverage is already complete and in the present case it is likely resulting from the hierarchical 3D structure.Author Contributions
All authors contributed equally to the writing of this paper. All authors read and approved the final manuscript.Conflicts of Interest:
The authors declare no conflict of interest.utton to change this htmlReferences
- Allison, I., Bindoff, N. L., Bindschadler, R. A., Cox, P. M., de Noblet, N., England, M. H., & Kaser, G. (2011). The Copenhagen Diagnosis: Updating the world on the latest climate science. Elsevier.[Google Scholor]
- Stoll, T., Zafeiropoulos, G., \& Tsampas, M. N. (2016). Solar fuel production in a novel polymeric electrolyte membrane photoelectrochemical (PEM-PEC) cell with a web of titania nanotube arrays as photoanode and gaseous reactants. International Journal of Hydrogen Energy, 41(40), 17807-17817. [Google Scholor]
- Oppenheim, J., & Beinhocker, E. D. (2009). Climate change and the economy: myths versus realities. McKinsey & Company, available at http://www. euractiv. com/25/images/Climate change myths. pdf (accessed on 15 July 2009).[Google Scholor]
- Lewis, N. S., & Nocera, D. G. (2006). Powering the planet: Chemical challenges in solar energy utilization. Proceedings of the National Academy of Sciences, 103(43), 15729-15735.[Google Scholor]
- Gondal, M. A., Hameed, A., Yamani, Z. H., & Suwaiyan, A. (2004). Production of hydrogen and oxygen by water splitting using laser induced photo-catalysis over Fe2O3. Applied Catalysis A: General, 268(1-2), 159-167.[Google Scholor]
- Balu, A. M., Pineda, A., Yoshida, K., Campelo, J. M., Gai, P. L., Luque, R., & Romero, A. A. (2010). Fe/Al synergy in Fe 2 O 3 nanoparticles supported on porous aluminosilicate materials: excelling activities in oxidation reactions. Chemical Communications, 46(41), 7825-7827. [Google Scholor]
- Warang, T., Patel, N., Santini, A., Bazzanella, N., Kale, A., & Miotello, A. (2012). Pulsed laser deposition of Co3O4 nanoparticles assembled coating: Role of substrate temperature to tailor disordered to crystalline phase and related photocatalytic activity in degradation of methylene blue. Applied Catalysis A: General, 423, 21-27.[Google Scholor]
- Guo, Q., Shi, W., Liu, F., Arita, M., Ikoma, Y., Saito, K., & Nishio, M. (2013). Effects of oxygen gas pressure on properties of iron oxide films grown by pulsed laser deposition. Journal of Alloys and Compounds, 552, 1-5.[Google Scholor]
- Gower, M. C. (2000). Industrial applications of laser micromachining. Optics Express, 7(2), 56-67.[Google Scholor]
- Cristino, V., Berardi, S., Caramori, S., Argazzi, R., Carli, S., Meda, L., & Bignozzi, C. A. (2013). Efficient solar water oxidation using photovoltaic devices functionalized with earth-abundant oxygen evolving catalysts. Physical Chemistry Chemical Physics, 15(31), 13083-13092.[Google Scholor]
- Van de Krol, R., & Grätzel, M. (2012). Photoelectrochemical hydrogen production (Vol. 90). New York: Springer.[Google Scholor]
- Horowitz, G. (1983). Capacitance-voltage measurements and flat-band potential determination on Zr-doped a-Fe2O3 single-crystal electrodes. Journal of electroanalytical chemistry and interfacial electrochemistry, 159(2), 421-436.[Google Scholor]


